The worst moment of every two hours
Every project has a Metrics tab now. CPU, memory, disk, network and HTTP for each service, thirty days back. Here is how it is built, which numbers we decided to show you, and the read that worked everywhere except production.
Until yesterday, the answer to "is my service about to fall over" was gg logs
and a good guess. Now every project page in the console has a Metrics tab, and
the guess is a graph.
Pick a service and you get CPU, CPU throttling, memory, network in and out, and disk if it has a volume. A service with an address also gets requests per second, the share of them that came back 5xx, and p95 latency. Each chart carries the service's limit as a dashed line, because 400 MB means nothing until you know it is 400 of 512. Down the left is every service and managed resource in the project, sorted so the one closest to trouble is at the top.
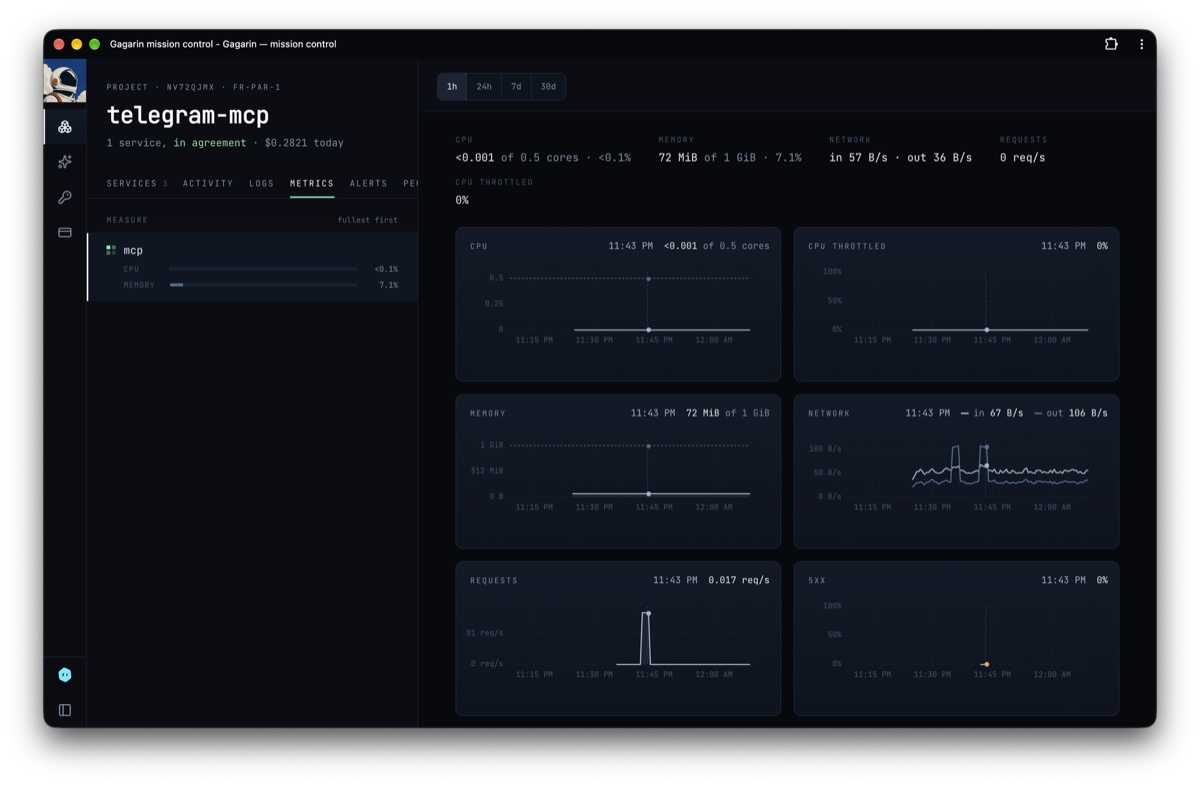
One of our own projects, over the last hour. The cursor is on a burst of requests, and every chart is reading 11:43 PM.
That is the tour. The rest of this post is the part we found interesting: what a point on those charts actually is, how the numbers get to you without anyone else's coming along, and one bug that taught us what a GET looks like from inside Kubernetes.
A point is the worst moment, not the average one
There are four windows, and each is a few hundred points wide:
| window | one point covers | points |
|---|---|---|
| 1h | 30 seconds | 120 |
| 24h | 5 minutes | 288 |
| 7d | 30 minutes | 336 |
| 30d | 2 hours | 360 |
We sample every 30 seconds, so on the 30-day chart a single point stands in for 240 samples. Something has to give, and what usually gives is the truth: most dashboards average. A service that sat at 20% memory for two hours, apart from the ten seconds it touched 99% and nearly died, averages out to a flat, reassuring line.
So we don't average. For anything measured as an amount (memory, disk), a point is the peak over its step. On the 30-day chart you are looking at the worst moment of every two hours. The line reads higher than an average would and that is the point: nobody opens a memory chart to find out how the service felt on a typical afternoon.
Try it. This is one simulated month of memory, folded both ways. Start at 30 days and walk down to one hour:
- one point is
- 2 hours · 240 samples
- peak line tops out at
- 99%
- average line tops out at
- 27%
Blue is the peak over each point's step, grey is the average. Same samples, made up for this post, with a few dozen spikes of a minute or less. At 30 days the average never leaves the floor. At one hour a point is a single sample, and the two lines are the same line.
Counters (CPU seconds, bytes, requests) are drawn as rates, which is the only honest way to draw a counter.
A gap is a gap
When a service restarts, or is not running, there are no samples. Plenty of charts draw a straight line from the last point before to the first point after, and now your graph shows memory gliding gently across an outage that never had any memory in it.
Ours stops and starts again. Missing samples are never interpolated, so a restart is a break in the line and you can see how long it lasted.
The same samples twice. On the left, the dashed stretch is invented: the service was down and nothing was measuring. On the right, what we draw.
The charts also share one cursor. Hover a spike in 5xx and the same instant is marked on memory, CPU and latency, which answers the question you were about to ask anyway: what else was happening right then?
Where the numbers come from
Nothing runs inside your container and there is nothing to install. The figures are the ones the node already keeps: cAdvisor for CPU, memory and network, the kubelet for volumes, and Traefik at the edge for requests and latency.
- 01your containernothing installed, nothing imported
- 02the nodecAdvisor, kubelet and Traefik already count it
- 03scraperevery 30 seconds
- 04store30 days, in this cluster, no address
- 05API serverget, on one Service
- 06enginea fixed catalogue, your namespace
- 07youthe tab, gg metrics, your agent
× a tenant container asking the store directly: timed out
Seven stops, and the store is the only one that keeps anything. Nobody reaches it except the scraper, and the engine by way of the API server.
Each cluster has its own single-node VictoriaMetrics, scraping every 30 seconds and keeping 30 days. The data stays in the cluster it describes. There is no central metrics warehouse with every customer's series in it, which is a whole category of incident we would rather not be able to have.
The store has no address. No ingress, no public endpoint, no new credential. A network policy lets exactly one thing talk to it, the scraper. We checked from the cheap seats: from inside a tenant container, the store times out by name and by IP while example.com answers 200.
The engine reaches it the way it reaches everything else in the cluster,
through the Kubernetes API server, with a role that grants get on that one
Service and nothing more.
You cannot write a query, on purpose
The usual way to build this is to hand the user a query box and then spend a
year making sure the query cannot see the neighbours. A label matcher is one
=~".*" away from being everybody's dashboard.
There is no query box. The engine holds a fixed catalogue of named expressions, and the only things it fills in are a namespace and a service. The namespace comes from the project you were authorised for, never from anything you typed. The service has to be one that project actually owns. Nothing a caller sends ends up inside PromQL.
The tests go after that directly. A stranger asking for someone else's metrics
gets 404 project_not_found, and the test also checks the fake store behind
it received zero queries, because a refusal that queried first and
filtered afterwards is a leak waiting for a bug. A service name carrying "}
or .* is turned away before a query exists. Each of those tests was run
against the code with the protection taken out, to make sure it fails. A test
that cannot fail is not a test.
The cost is real: you can't graph anything we didn't think of. We'll take that trade for now.
The read that worked everywhere but production
Everything passed locally. The first read in production came back 422.
The engine runs under an admission policy that confines it. Among other
things, it may not open a connection into anything outside tenant namespaces,
so a compromised engine can't wander around the cluster. Opening a connection
is the CONNECT operation: exec, attach, port-forward.
Here is what we didn't know. When you send a plain HTTP GET through the API
server's service proxy, RBAC sees the verb get. Admission sees the operation
CONNECT. Same request, two names, depending on which layer you ask. Our
policy saw the engine trying to CONNECT into the monitoring namespace and did
its job.
GET …/services/<store>/proxy/…
getallowedCONNECT422Both are right. RBAC judges the HTTP verb, admission judges the operation, and a request through a proxy subresource is a CONNECT whatever verb it carries.
Two things made it slow to find. The client library reported it as
client error: 422 and kept the reason to itself. And the local harness
doesn't install the confinement policies at all, so the one environment where
we could iterate quickly was the one where the bug couldn't exist. We found it
by impersonating the engine's identity with kubectl --as and reading the
refusal by hand.
The fix is an exception as narrow as the read: CONNECT, on the service proxy,
for that one Service. RBAC still decides the HTTP verb, and it only grants
get. The platform's verification script now checks all three sides: the read
goes through, a write in that namespace is refused, and exec into the store's
pod is refused.
If you run admission policies of your own, this one is free: a proxied GET
is a CONNECT, and a policy written to stop exec will stop it too.
Four alerts, no knobs
A graph nobody is looking at is a diary. So the same numbers feed four alerts, pushed to your phone:
| alert | fires | clears |
|---|---|---|
memory_high | 80% of limit for 5 minutes | under 75% for 5 minutes |
cpu_high | 80% of limit for 10 minutes | under 70% for 5 minutes |
disk_high | 85% full, two readings running | under 80% |
errors_high | 5% of requests 5xx over 5 minutes, at least 20 requests | under 2% |
There are no thresholds to set, deliberately. Three details did the real work.
The clear line sits below the fire line. A service hovering at 80% would otherwise page you every other minute. It has to come properly back down before we call it over.
- fires at 80%, pushes sent
- 4
- time spent alerting
- 48 min
- what actually happened
- one problem
A simulated service sitting right on the line, run through the real rule. Clear at 80% and every wobble is a fresh page. Clear at 75% and it is one alert, open until the service has actually come down.
The alert reads raw samples, not chart peaks. Our first version fed the memory alert the same two-minute peak the dashboards use. One spike a minute then looks like five solid minutes above the line. A peak is the right thing to draw and the wrong thing to count.
Unmeasured is not fine. If the store can't be read, the alert pass fires nothing and resolves nothing. "I couldn't check" must never arrive on your phone as "all clear".
errors_high wants 20 requests because one failed request out of one is
100% and nobody should be woken for it.
We drilled it on production with a real volume and a real phone:
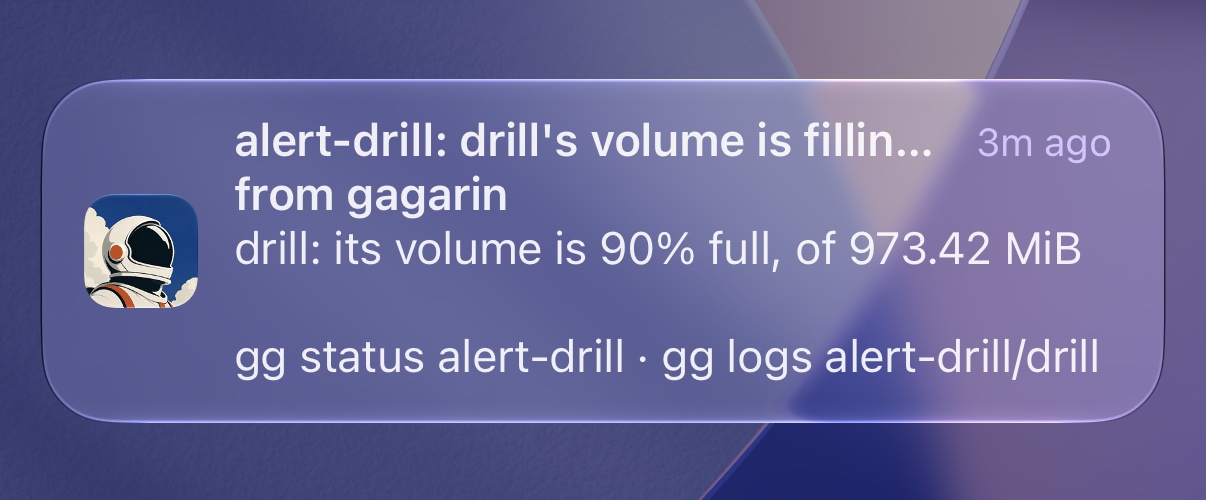
The push as it landed. It says what is wrong, how wrong, and the two commands you would type next.
- volume filled to 90%
- push: “its volume is 90% full”
- file deleted
- push: resolved
Black is what we did, orange and blue are what the phone said about it. The widths are the real intervals.
Two and a half minutes to fire. Four to resolve, and most of that is the kubelet, which went on reporting the deleted file for three minutes after it was gone. Volume stats are a rumour that takes a while to catch up.
The push links straight to the tab with that service already selected. The service and the window live in the URL, so the link you get is the graph the alert was about.
What isn't there yet
- Restart and OOM markers. A restart shows as a gap today. It should show as a mark that says why.
- Database internals. You get CPU, memory and disk for your Postgres, not connections or query time. Each engine needs its own exporter and we haven't written them.
- Live refresh. The tab draws when you open it or change the window. It doesn't tick.
Not just a tab
Everything in the console is also a command, and this is no exception:
$ gg metrics alert-drill
SERVICE KIND      CPU             MEMORY               DISK                    THROTTLED NET IN/OUT       REQ/S 5XX P95
drill   container <0.01/0.5 (0%)  24.2 MB/1.00 GB (2%) 880.3 MB/973.4 MB (90%) 0%        62 B/s / 34 B/s  0/s   -   -
gg metrics PROJECT/SERVICE --window 7d gives one service over a window: last
value, how long ago it was taken, average, peak and limit for each series. Your
agent has the same read as an MCP tool, so "why is api slow" can start from the
numbers instead of from a guess.
It is in gg 0.62.0 and in every project at
my.gagarin.cloud today. Open one, press Metrics,
and go find the worst moment of your last two hours.